

Most people assume the NRC, the Noise Reduction Coefficient, tops out at 1.00. After all, that means 100% of the sound is absorbed, right?
Yes, and no.
Here’s the truth: a panel tested in a laboratory can come back with an NRC of 1.05, 1.10, or even higher. It’s not a mistake. It’s not marketing inflation. It’s real physics plus a little arithmetic, and it tells you something useful about how a panel works.
What NRC Actually Measures
NRC is a simplified score, averaging how much sound a material absorbs at 250Hz, 500Hz, 1000Hz, and 2000Hz, four bands across the voice range, and rounded to the nearest 0.05.
-
0.00 = reflects all sound
-
1.00 = absorbs all sound
-
> 1.00 = ...wait, what?
That’s where things get interesting.
Why It Can Go Over 1.0
1.0 is often described as “100% absorption,” and for sound arriving at a flat face that is a fair picture. But a laboratory coefficient is worked out in a particular way. The lab measures how much sooner a large, echoing test room goes quiet with the sample inside, turns that into an amount of absorption, and divides it by the sample’s face area. Whatever the sample absorbs through its sides, round its edges and from underneath is counted too, but it is still divided by the face alone.
And a real panel is more than a face.

If a panel is:
- thick, with bare sides (a thick slab of felt or fibre with uncovered edges absorbs through its sides too, but they are not in the face area; ours are framed round the sides, so on them this counts only for the felt standing proud of the frame)
- raised off the surface on an air gap with its edges left open (the gap lets the felt work on lower notes, and the open rim lets sound in underneath as well as at the face)
- a finite patch with plenty of edge, where edge diffraction comes in (sound bends round the edge of an absorber, so the panel draws in sound from a little beyond its own outline; acousticians call this the edge, or area, effect, and sculpted or angled shapes add more edges)
...it can absorb more total energy than its face area alone would suggest.
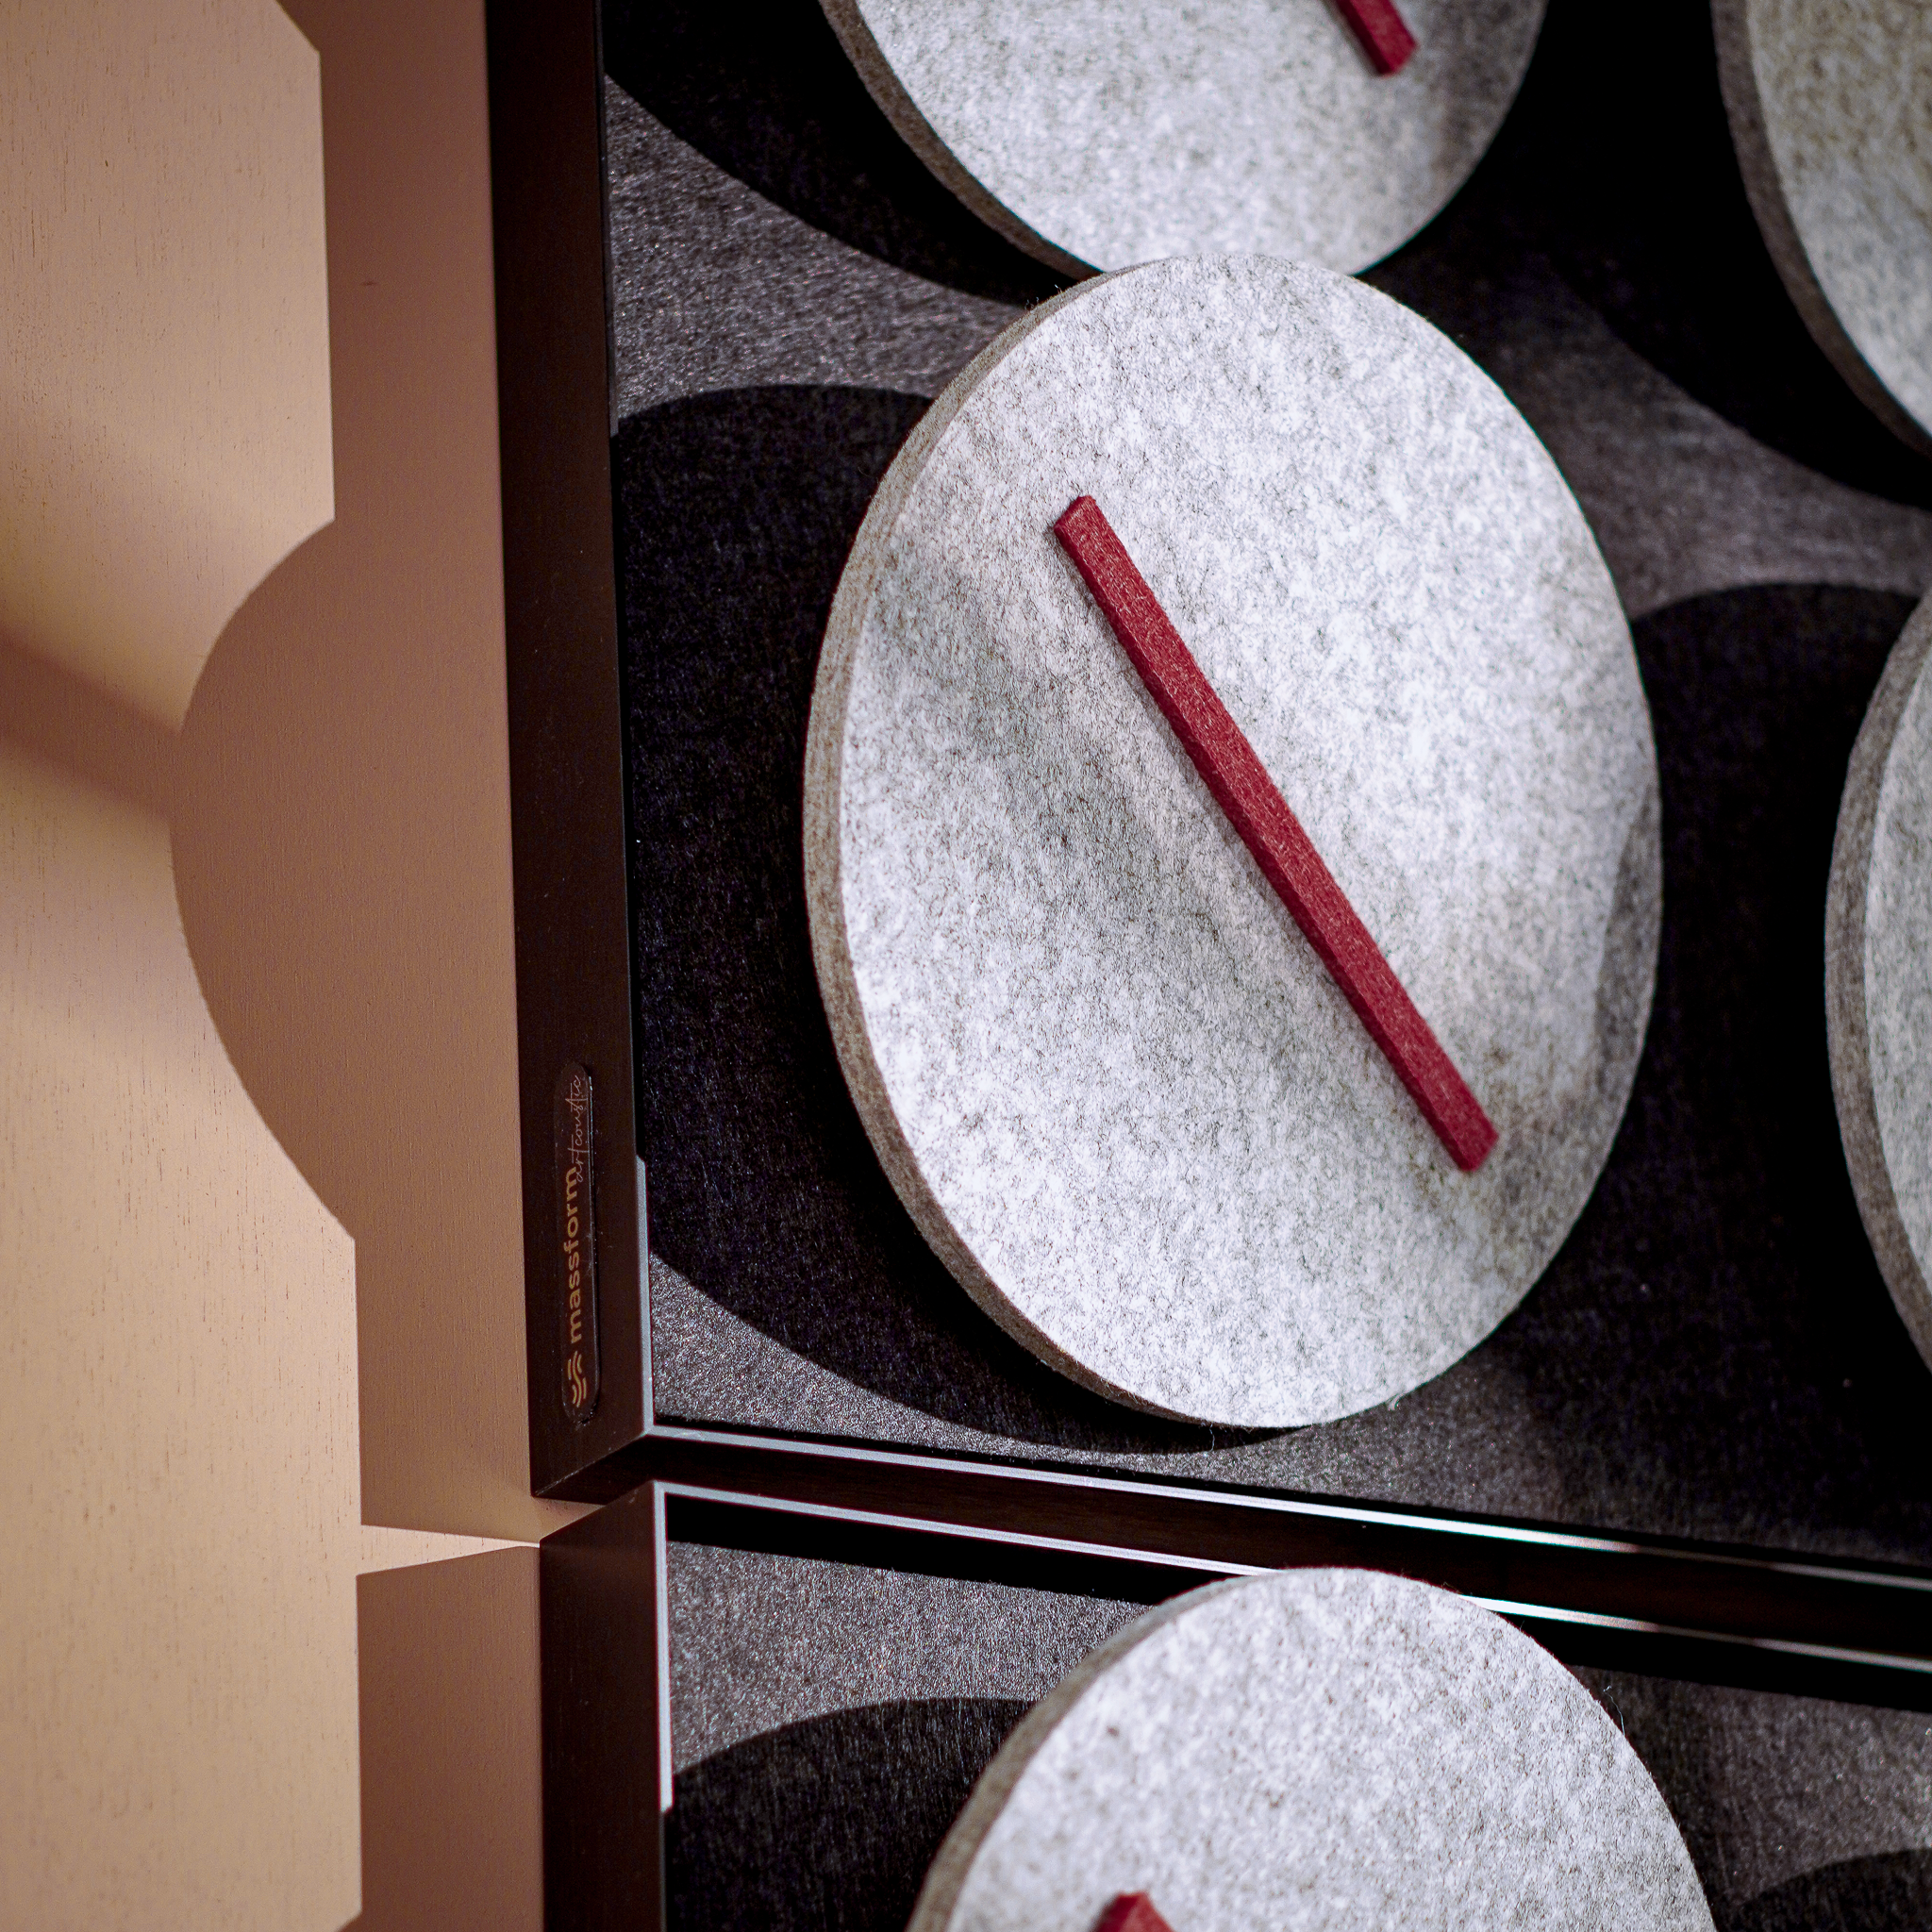
Below is Cymbals Pro, which reads the highest NRC in the range: 1.35 on its own and 1.50 with a Basstrap. Those come from our own office REW measurement, calibrated against the laboratory’s Surge Pro result, and the with-Basstrap figure is calculated rather than measured, so they are not laboratory numbers like the table further down. Part of the reason it reads so high is the same one, though. Its tilted discs give sound more than three and a half times the felt of a flat panel, edges and undersides included (measured from our 3D models), and sound bends round every one of those edges into the felt. It has a lot of edges.

In other words, a panel can punch above its weight, and a laboratory test records that honestly.
How It Happens
Here’s an example from the university laboratory test of Surge Pro on a Basstrap, at its peak band, 400 Hz, and the bands either side:
| Frequency (Hz) | Absorption coefficient α (Surge Pro + Basstrap) |
|---|---|
| 315 | 1.28 |
| 400 | 1.31 |
| 500 | 1.19 |
From report A-11-2025 by the Acoustics Laboratory at National Taiwan Ocean University (NTOU), ASTM C423-22: 19 panels 50 mm thick, 10.999 m² in all, raised 35 mm with the edges left open, each panel on a 50 mm Basstrap. A single frequency band gives an absorption coefficient, not an NRC.
The NRC averages the four bands and rounds to the nearest 0.05, as the standard requires. For this configuration the four bands average 1.13, printed as 1.15. The rounding is not always in our favor: Surge Pro on its own (report A-10-2025) averages 0.9725 and is printed as 0.95. If you have seen 0.97 quoted for Surge Pro, that is the unrounded figure. So Surge Pro publishes as NRC 0.95 without a Basstrap and NRC 1.15 with one.

These aren’t “errors.” They show the sample absorbing more energy than its face area accounts for, mostly at its edges. The 35 mm gap beneath it was left open at the rim, so sound got in underneath as well as at the face, and sound bending round the edges was drawn into the felt too. The 19 panels were laid edge to edge, so that was the outer edge of the whole array, not of every panel.
What It Means for You
If you see values above 1.0 on our charts, here’s what it means:
- The panel absorbs strongly in those bands, and the test counted its edges as well as its face
- It's working not just at the front surface, but as a whole: its depth, its air gap and its open edges all count
- In a room, it means less echo in those bands. For Surge Pro on a Basstrap they start at about 250 Hz: the low mids, where a room’s muddiness tends to collect
- It does not mean the panel absorbs more sound than reaches it. It means more sound reaches it than its face area would suggest
- On a wall, panels hung with gaps between them each get edges of their own for sound to bend round, so spaced panels absorb more per panel than the same panels butted together

And we’d rather show you real data than flatten the numbers to fit old expectations.
Want to See the Lab Report?
Here are the laboratory’s test reports for download, each in our English translation followed by the Chinese original. The reports call the specimen Wave, the name we gave the laboratory for 19 panels of Surge Pro’s construction in two sizes.
Download the Surge Pro + Basstrap test report, A-11-2025 (PDF)
Download the Surge Pro test report without Basstrap, A-10-2025 (PDF)
For how the laboratory ran the test, and what the Basstrap does to the low bands, see Behind the Numbers. To read our absorption charts yourself, see how to read a 1/3 octave chart.
Next in the Series
Vol. 2: What Is an Air Gap, and Why Does It Help? Because sometimes the space behind a panel is doing more than you think.



Share:
Behind the Numbers: Our Acoustic Testing Explained
When Art Absorbs More Than Expected, the Crazy Performance of Our Cymbals Series