Because no one wants to pretend they know what 315Hz means
Let’s be honest — 1/3 octave absorption charts look intense. A wall of frequencies, decimals, and alpha values that feel more like an audiology exam than something for your living room.
But if you know how to skim them, they can tell you everything you need to know about how a panel will actually feel in a room.
So let’s break it down — in human terms.
What Is a 1/3 Octave Chart?
It’s a graph that shows how much sound energy a panel absorbs at different frequencies — broken down into fine steps across the human hearing range.
Each number (like 125Hz, 250Hz, 500Hz, etc.) represents a “band” of frequencies. 1/3 octave just means we’re slicing that range into more precise pieces than the usual 4-band NRC average.

What It Shows:
- Low frequencies (below 250Hz): Bass, boom, sub energy
- Mid frequencies (250Hz–2kHz): Vocals, body, warmth
- High frequencies (2kHz–8kHz): Air, sparkle, sibilance
- Very high frequencies (10kHz+): Room brightness and edge reflections
Each bar shows an absorption coefficient (α).
-
0.0 = reflects all sound
-
1.0 = absorbs all sound
-
Above 1.0? That’s Vol. 1 material 😉
What to Look For (Even If You’re Not an Engineer):
Where does the curve start to rise?
If absorption begins early (like at 160Hz or 200Hz), the panel is doing serious low-end work. If it starts at 500Hz? It might leave your bass untouched.
Is it strong around 500–2kHz?
This is the vocal clarity zone — especially important for podcasters, singers, or therapists.
Does it taper off or stay smooth up high?
A smooth high-end means less room slap. A jagged falloff might leave flutter echoes.
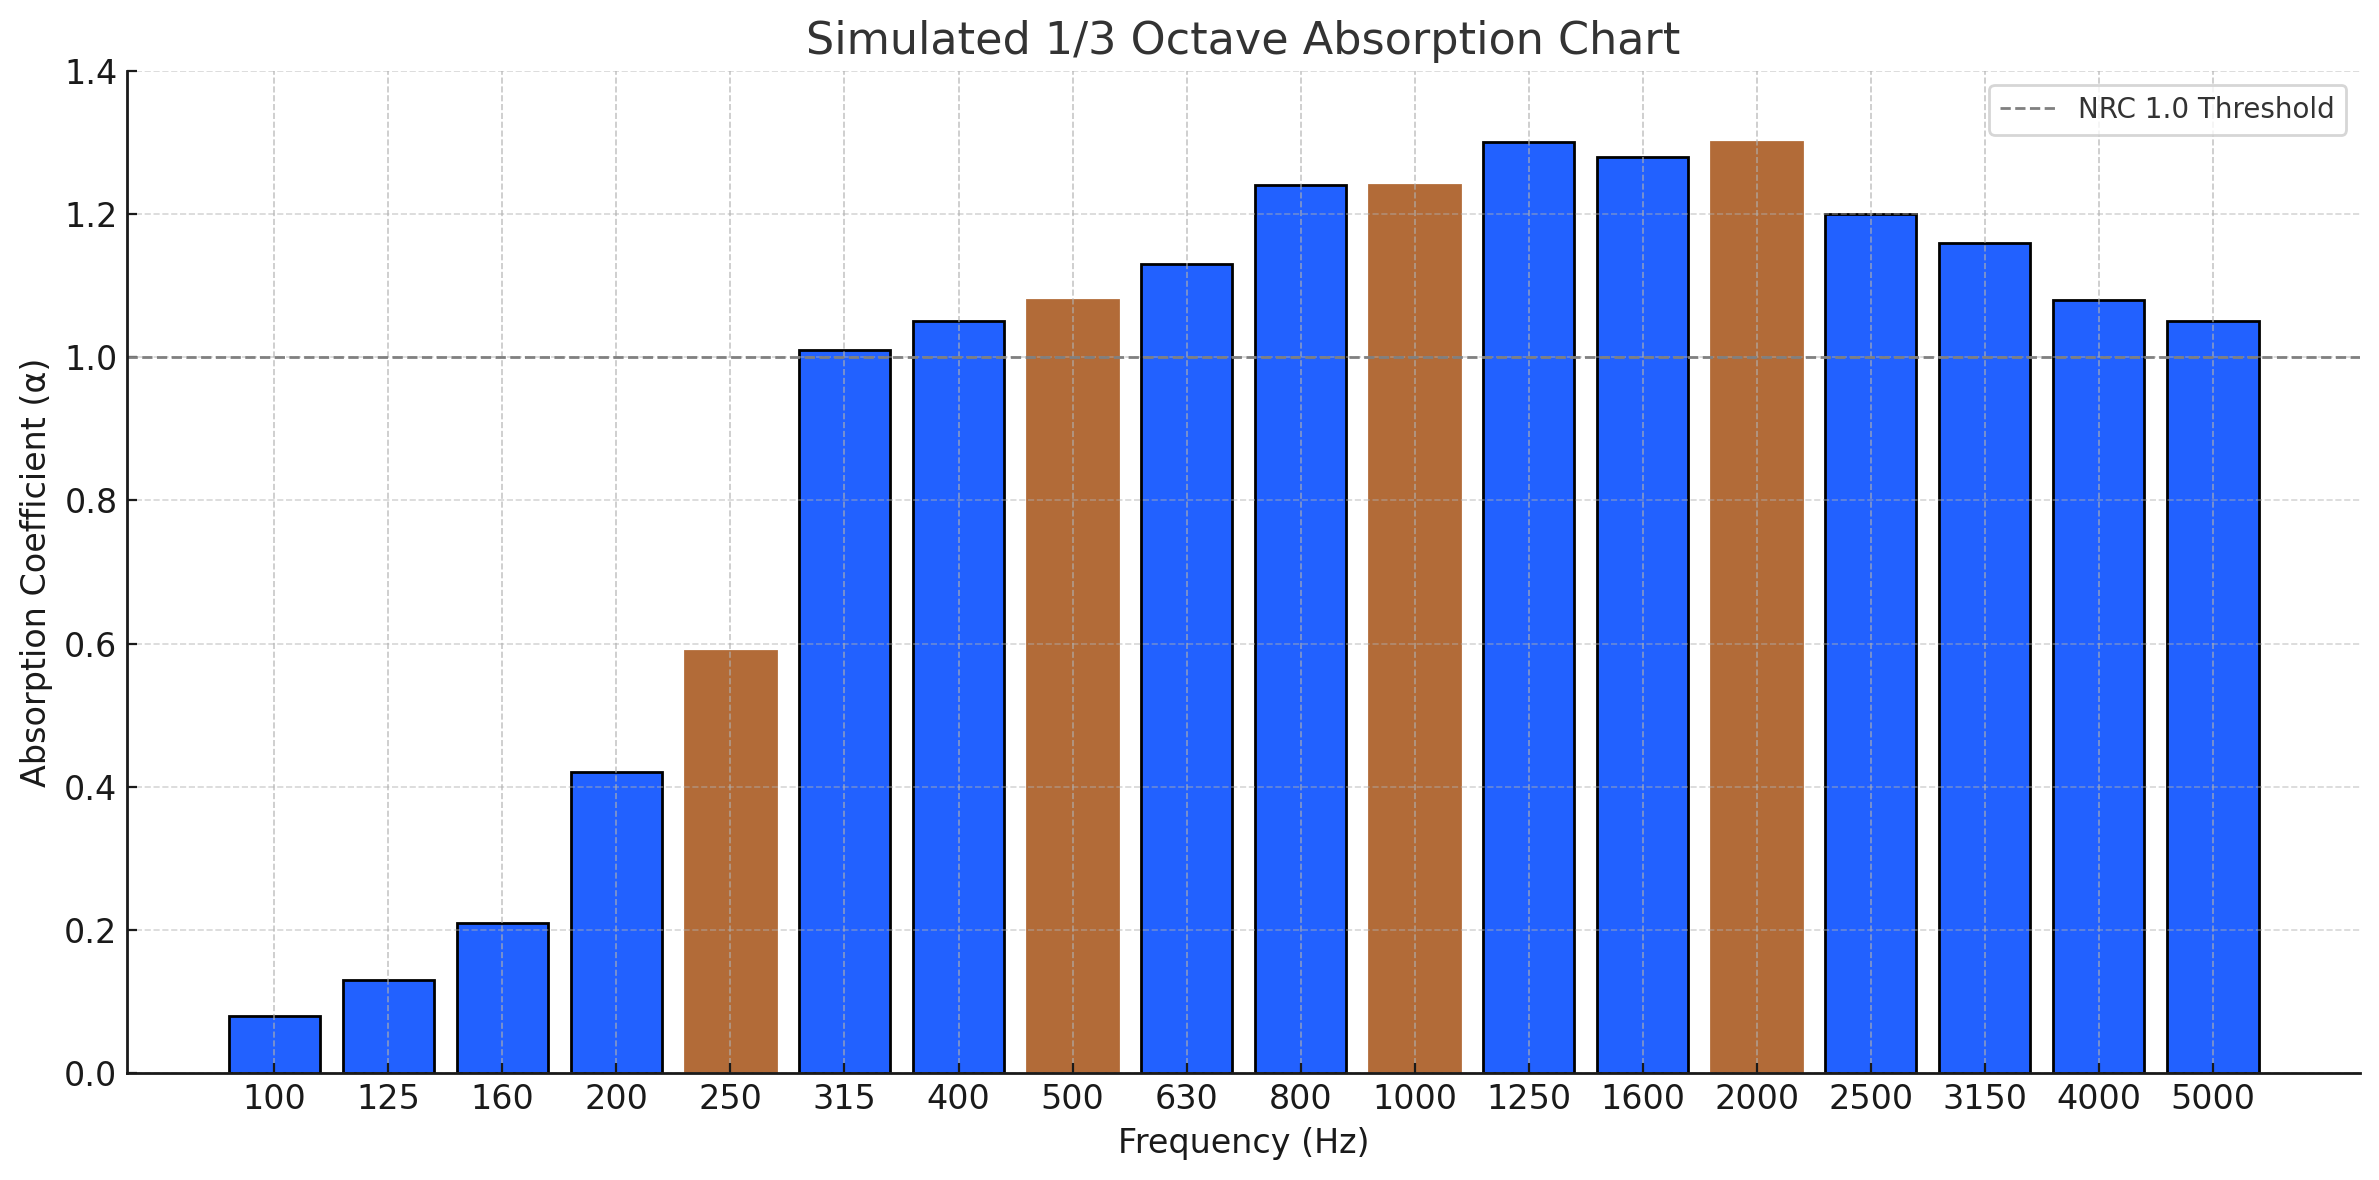
Real Example — Surge + Bass Trap
| Frequency | Absorption (α) |
|---|---|
| 160 Hz | 0.42 |
| 315 Hz | 1.01 |
| 500 Hz | 1.08 |
| 1000 Hz | 1.24 |
| 2000 Hz | 1.30 |
| 4000 Hz | 1.08 |
Translation:
This panel starts absorbing early and stays smooth and strong.
You’ll feel this as clean bass, tight mids, and a clear top end — not just quietness.
TL;DR
You don’t need to memorize all the numbers. Just look at the curve:
- Early rise = bass absorption
- Mid bump = speech clarity
- Smooth top = less echo
If it reads like music — it’ll probably feel like it too.


Share:
Beyond the Spec: What’s Your Sound Made Of?
Thickness, Density, and Porous Flow Resistivity: What Really Shapes Sound