

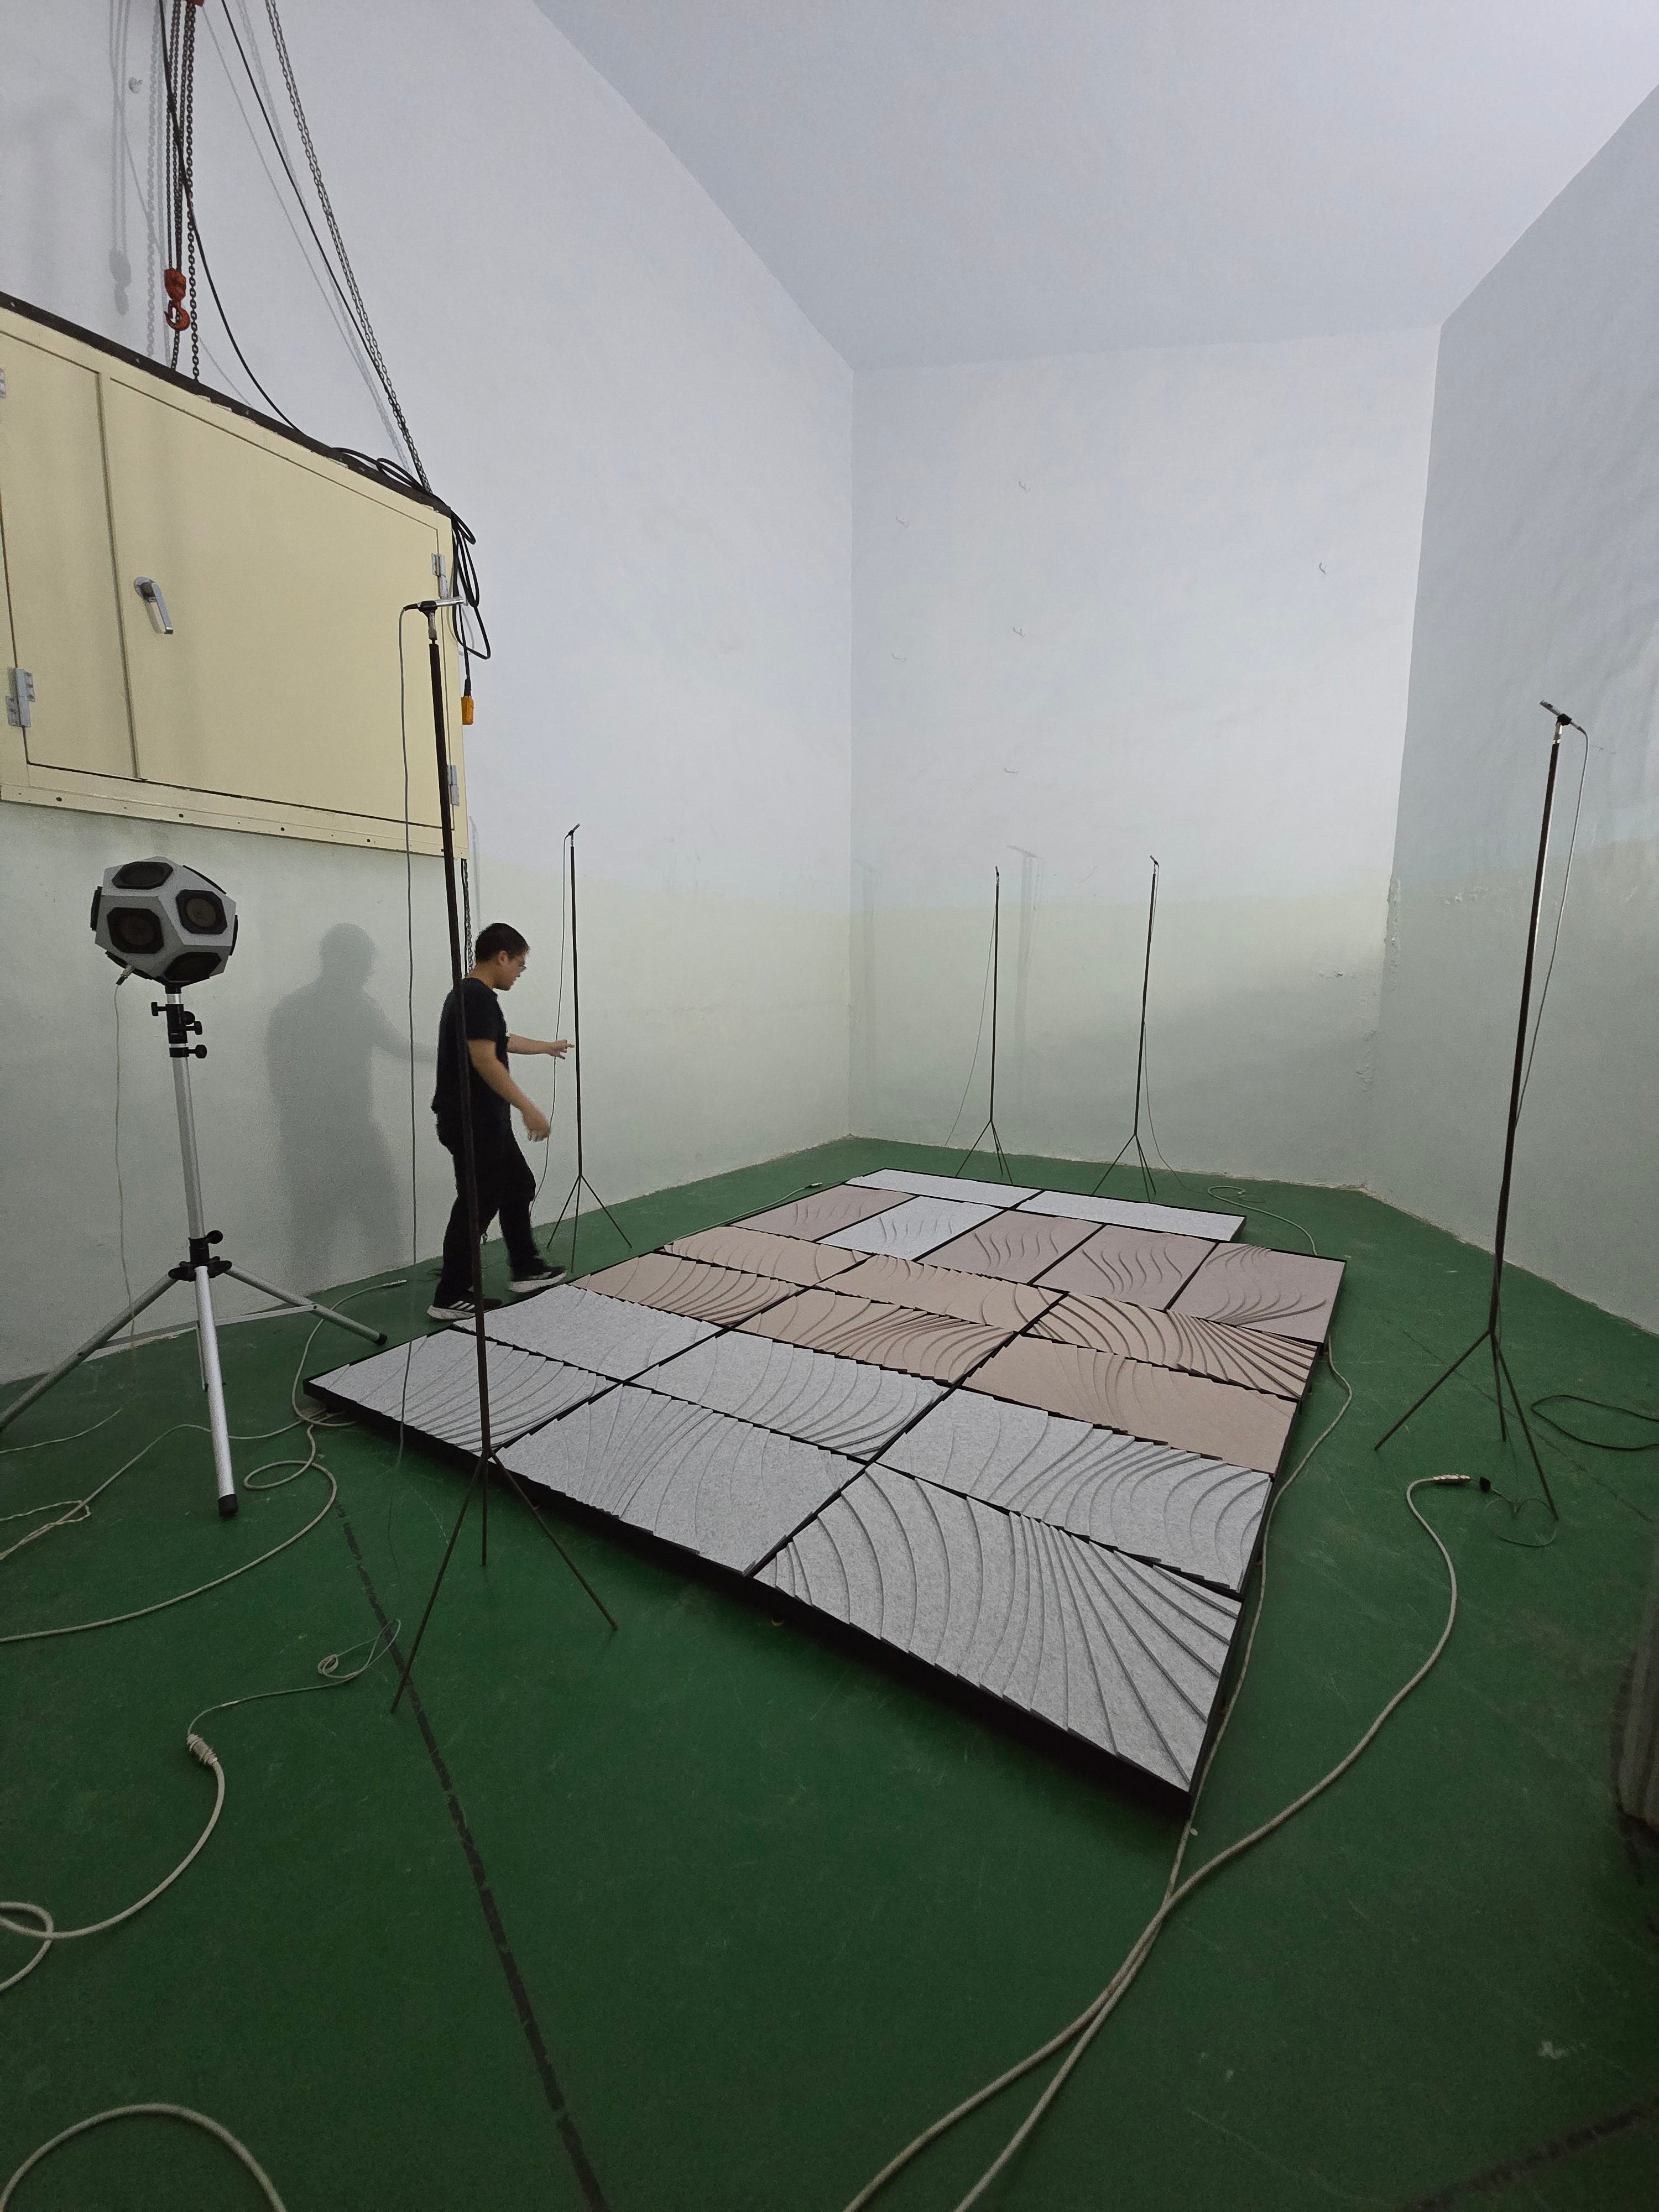
Surge Pro and Wave were tested by a university acoustics laboratory to ASTM C423-22. This page gives the results band by band, with both laboratory reports to download. It then sets them beside our own measurement of the same panels in an ordinary room, raw files included, and explains why a room and a laboratory never agree exactly.
About the test
We had the Acoustics Laboratory at National Taiwan Ocean University (NTOU), a TAF-accredited testing laboratory (no. 3516), measure absorption to the ASTM C423-22 standard. The method uses a reverberation room: a large, hard-walled room built to echo for as long as possible. It is the one room nobody would choose to live in, and the right one for this job. The laboratory times how long sound takes to die away with and without the specimen inside, and the difference gives how much sound the specimen absorbs in each frequency band.
Two configurations were tested:
- Surge Pro on its own, raised 35 mm (report A-10-2025)
- Surge Pro on a 50 mm Basstrap (report A-11-2025)
Test setup
- Laboratory: Acoustics Laboratory, National Taiwan Ocean University (NTOU), TAF-accredited testing laboratory 3516
- Standard: ASTM C423-22, reverberation room method
- Reports: A-10-2025 without Basstrap, A-11-2025 with Basstrap. Tested 30 April 2025, issued 8 May 2025
- Specimen: 19 panels of one construction, 50 mm thick, in two sizes: 7 at 1175 × 575 mm (the Surge Pro 2'x4' size) and 12 at 950 × 550 mm (the Wave panel size), 10.999 m² in all. The reports name the specimen Wave
- Mounting: raised 35 mm off the test surface, laid edge to edge with the outer edges left open, the same 35 mm the spacers give a Surge Pro panel on a wall. The reports name no ASTM E795 mounting type
- With Basstrap: each panel sat on a 50 mm Basstrap of the same size, 100 mm in all, on the same 35 mm raise
- Frequency range: 100 Hz to 5000 Hz, in one-third octave bands

The numbers
Surge Pro and Wave: NRC 0.95 without Basstrap, NRC 1.15 with Basstrap. NTOU, ASTM C423-22, reports A-10-2025 and A-11-2025. Massform publishes this result for Surge Pro in both sizes and for Wave.
NRC is the average of four bands (250, 500, 1000 and 2000 Hz), rounded to the nearest 0.05 as the standard requires. Before rounding, the averages are 0.9725 without Basstrap and 1.13 with it. If you have seen 0.97 quoted for Surge Pro, that is the unrounded figure.
The sound absorption average (SAA), the mean of the twelve bands from 200 to 2500 Hz, works out at 0.95 without Basstrap and 1.13 with it. The reports do not print an SAA: these two are calculated by Massform from the laboratory's band values.
What the results show
With the panels alone, on the 35 mm raise (A-10-2025):
- Absorption climbs steeply through the low mids: 0.59 at 250 Hz, 0.95 at 400 Hz.
- The absorption coefficient first reaches 1.0 at 500 Hz, where it reads 1.15.
With each panel on a Basstrap (A-11-2025):
- The absorption coefficient reaches 1.0 at 200 Hz, down from 500 Hz without it.
- 160 Hz rises from 0.21 to 0.83.
| Frequency (Hz) | Surge + Air Gap (A-10-2025) | Surge + Bass Trap (A-11-2025) |
|---|---|---|
| 125 | 0.08 | 0.25 |
| 160 | 0.21 | 0.83 |
| 200 | 0.31 | 1.00 |
| 250 | 0.59 | 1.18 |
| 315 | 0.73 | 1.28 |
| 400 | 0.95 | 1.31 |
| 500 | 1.15 | 1.19 |
These are the absorption coefficients from 125Hz to 500Hz, as printed in the laboratory's reports. Tested by NTOU to ASTM C423-22, April 2025: 19 panels, 10.999 m², raised 35 mm with open edges. With the bass trap, each panel sat on a 50 mm Basstrap. The reports run on to 5000 Hz. From 1000 Hz up the two configurations read much the same: 1.10, 1.05 and 0.88 at 1000, 2000 and 4000 Hz on their own, and 1.11, 1.04 and 0.96 with the Basstrap.
A coefficient above 1 does not mean the panel absorbs more sound than reaches it. That would be a different kind of product. The specimen's outer edges and the 35 mm gap beneath it were open, so sound reached the felt round the edges and from underneath as well as at the face, and ASTM C423 divides by the face area alone. Why an NRC over 1.0 is possible goes through it in more detail.
📥 Download the lab report A-10-2025, Surge + Air Gap (PDF)
📥 Download the lab report A-11-2025, Surge + Bass Trap (PDF)
Each file is our English translation of the laboratory's report, followed by the original in Chinese, exactly as the laboratory issued it.
What this means
The low mids, roughly 150 to 400 Hz, are where a room's muddiness tends to collect, and where a 50 mm panel on its own is still climbing. For a sense of scale, our compare page sets the lab curves beside two common 50 mm fibre boards, brands not named, tested bare, from their makers' published laboratory data and not measured by us. That page averages our three one-third octave bands in each octave, so its 250 Hz figures run a little differently from the single band in the table above: the boards about 0.70, Surge Pro on its own about 0.54, and Surge Pro on a Basstrap about 1.15. The laboratories and mountings differ, so read that as context rather than a contest.
Adding one 50 mm Basstrap behind each panel, 100 mm in all, moved the point where the coefficient first reaches 1.0 from 500 Hz down to 200 Hz, and lifted 160 Hz from 0.21 to 0.83. That is a significant shift for 50 mm of added depth.
It does not reach the deep bass. Even with the Basstrap, the report reads about 0.25 at 100 and 125 Hz. Below about 150 Hz, start by moving the speakers and the listening seat; the bass trap guide covers what a Basstrap can and cannot do. Only one Basstrap layer has been tested, so one layer is all we quote.
The same panels in an ordinary room
A laboratory gives a reference that anyone can repeat. We also wanted to know what the same panels do in a room like the ones people use, so we measured Surge Pro in our own studio and published the raw files.
- Room: Massform's studio, 19.6 m² floor, 55.5 m³, with no acoustic panels of its own
- Panels: 8 Surge Pro 2'x4' panels, 5.4 m² of panel face, on their 35 mm spacers
- Microphone: UMIK-1 with its 90-degree calibration file, pointing up
- Speaker and amplifier: KEF Q350, ICEpower 100AS2
- Software: REW (Room EQ Wizard)
- Positions: 4 microphone positions, 5 sweeps at each, averaged
- Room fittings: plywood ceiling reflectors and lightweight diffusers, fitted for the measurement
- Calculation: the reverberation time (T30, read from the decay between 5 and 35 dB down) with and without the panels gives the added absorption by the Sabine equation, divided by the panel area

The studio set up for the measurement, with the ceiling reflectors and floor diffusers fitted to break up flutter echo between its bare surfaces.

Here is the laboratory result beside the room, octave by octave. The room values are a Massform in-room measurement, not a laboratory test.
| Frequency (Hz) | NTOU laboratory (A-10-2025) | Massform studio (REW) | Lab minus room |
|---|---|---|---|
| 125 | 0.08 | 0.17 | -0.09 |
| 250 | 0.59 | 0.72 | -0.13 |
| 500 | 1.15 | 0.69 | 0.46 |
| 1000 | 1.10 | 1.32 | -0.22 |
| 2000 | 1.05 | 1.15 | -0.10 |
| 4000 | 0.88 | 1.22 | -0.34 |
| Four-band average, unrounded | 0.9725 | 0.970 | under 0.01 |
| NRC, rounded to 0.05 | 0.95 | 0.95 | 0.00 |
Band by band, the room and the laboratory differ by up to 0.46. Averaged over the four NRC bands, they agree to within 0.01. Both facts are useful. The agreement is why the room is a fair place to measure panels. The band differences are why, when we measure a panel that has not been tested by a laboratory, such as Rhythm Pro, we correct each band against Surge Pro's laboratory result and label the result as our own measurement, not a laboratory one.
Download the in-room data
The REW files hold every sweep from all four positions. Use them to check our figures in REW, see how the panels change the room's decay, or compare them with your own measurements.
- REW file: the empty room (.mdat)
- REW file: the room with 8 Surge Pro panels (.mdat)
- Google Sheet: raw and averaged absorption data
REW is free. If you have not used it before, write to us and we will walk you through it.
Why your room can differ from the lab
A laboratory value describes the panel under fixed conditions: an 11 m² array, in a room where sound arrives from every direction, measured so that another laboratory could repeat it. Your room changes three things.
- Edges and spacing. The open edges and the raise are part of why the laboratory values pass 1. Panels spaced apart on a wall expose more edge per square metre than one 11 m² block; panels butted into a full wall expose less. The same panel can do a little more or a little less per square metre than the report says.
- What the room already has. A panel's effect depends on how much absorption the room already holds. The same eight panels shorten the echo of a bare room far more than that of a furnished one, so a percentage of wall covered does not carry from one room to another.
- Small rooms and bass. Below about 200 Hz, a room the size of our studio behaves as a handful of resonances rather than an even spread of sound, and readings there depend on where the speaker and the microphone stand.

What we measured in our own room: with 8 Surge Pro 2'x4' panels, 5.4 m² of panel face or about a tenth of the studio's wall area, the reverberation time (T20, read from the decay between 5 and 25 dB down and averaged over the four positions) fell by 24 to 29% from 1 to 8 kHz, about a quarter shorter. It changed much less in the bass, where the panel on its own absorbs much less.
The check that matters for your room: starting from the empty studio's measured reverberation and adding those 8 panels at the laboratory's values, the calculation behind Hear your room predicted the treated studio within 8% at every octave from 250 Hz to 4 kHz. In a room we have not measured it can be further out, which is why its answers are estimates, not measurements.
If panels sound better than their numbers suggest, the explanation is usually plain. What you hear is how long the room keeps ringing, and absorption is what shortens it. A quarter less ring from 1 kHz up is easy to hear. NRC is a single average of four bands, so it cannot show which bands changed most, and the ear hears each of them.
Try it on your own room
Hear your room works out a room's echo time from its size and surfaces, then plays a voice through it as it is and with panels. Plan in 3D lets you place the panels on your own walls first. For a second opinion, send a photo to the concierge, an automated acoustics concierge trained by the Massform team.
This result is published for Surge Pro 2'x4', Surge Pro 2'x2' and the Wave set.

The with-Basstrap figures are for those panels on a Basstrap Pro. Every series side by side is on the compare page.

Corrections, October 2026: an earlier write-up of this test called the mounting ASTM E795 Type A, which means no air space behind the specimen; the panels were raised 35 mm with open edges. It also printed the laboratory's 125 Hz value as 0.13 (the report reads 0.08) and the studio's 500 Hz value as 0.82 (it is 0.69; 0.82 is the 400 Hz value). Until 21 October 2026, this page's own with-Basstrap column matched neither report; it now prints A-11-2025. The figures above are the corrected ones.


Share:
In-Room Test: Rhythm Pro Acoustic Panel
Beyond the Specs: Why Is NRC Over 1.0 Possible?