What We Tested
We tested the Rhythm Pro 2’x4” panel in a 55.54 cubic meter untreated room using real-world audio tools — not a lab.

Equipment & Setup
- Mic: UMIK-1 (calibrated), 90 degree calibration file (mic pointing upwards)
- Speaker: KEF Q350 (frequency response 50hz- 25000hz)
-
Amplifier ICEpower 100AS2
- Software: REW (Room EQ Wizard)
- Room size: 19.61 square meter, 55.54 cubic meter
- Mic positions: 4 locations, 5 test at each location averaged
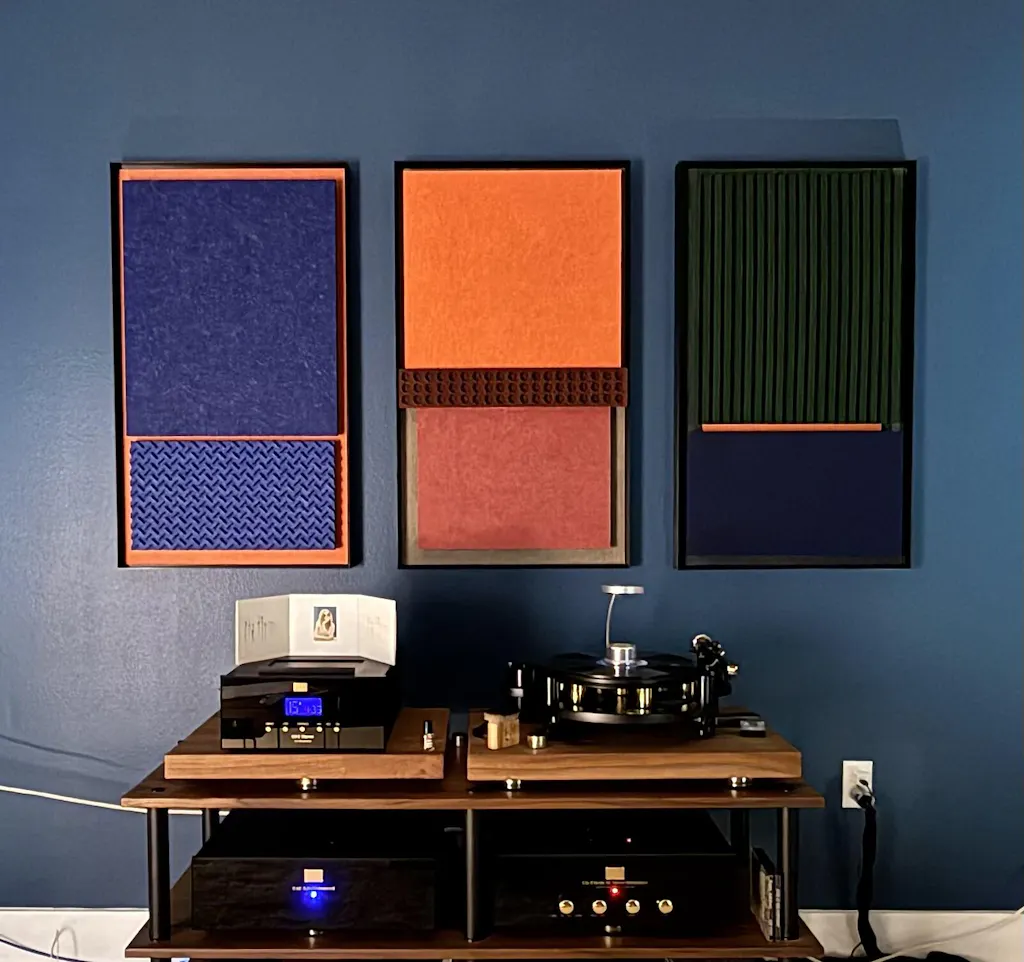
- Panel placement: Wall-mounted with 35mm built-in air gap
- Number of Panels: 8
- Hanging Method: 35mm air gapped
Calibration & Method
To ensure our in-room test results are reliable, we first tested the Surge panel in an accredited lab (ASTM C423). We then measured the same panel in our in-room setup using REW. The difference between the lab and in-room results gave us a calibration offset (delta). We applied this correction factor to the Rhythm Pro measurements — so the numbers reflect what you’d likely see in a controlled lab test.

Why We Didn’t Lab-Test Rhythm (Yet)
While Rhythm Pro’s size and format can technically be lab-tested under ASTM C423, we faced challenges getting local labs in Taiwan to accommodate our modular panel structure — especially since they required test mounts that don't match our actual installation method.
Rather than force a non-representative test, we calibrated our in-room measurements against the lab-tested Surge panel (same material, similar depth), to give you a realistic and honest performance benchmark — one that reflects how Rhythm behaves in actual rooms, not in idealized setups.
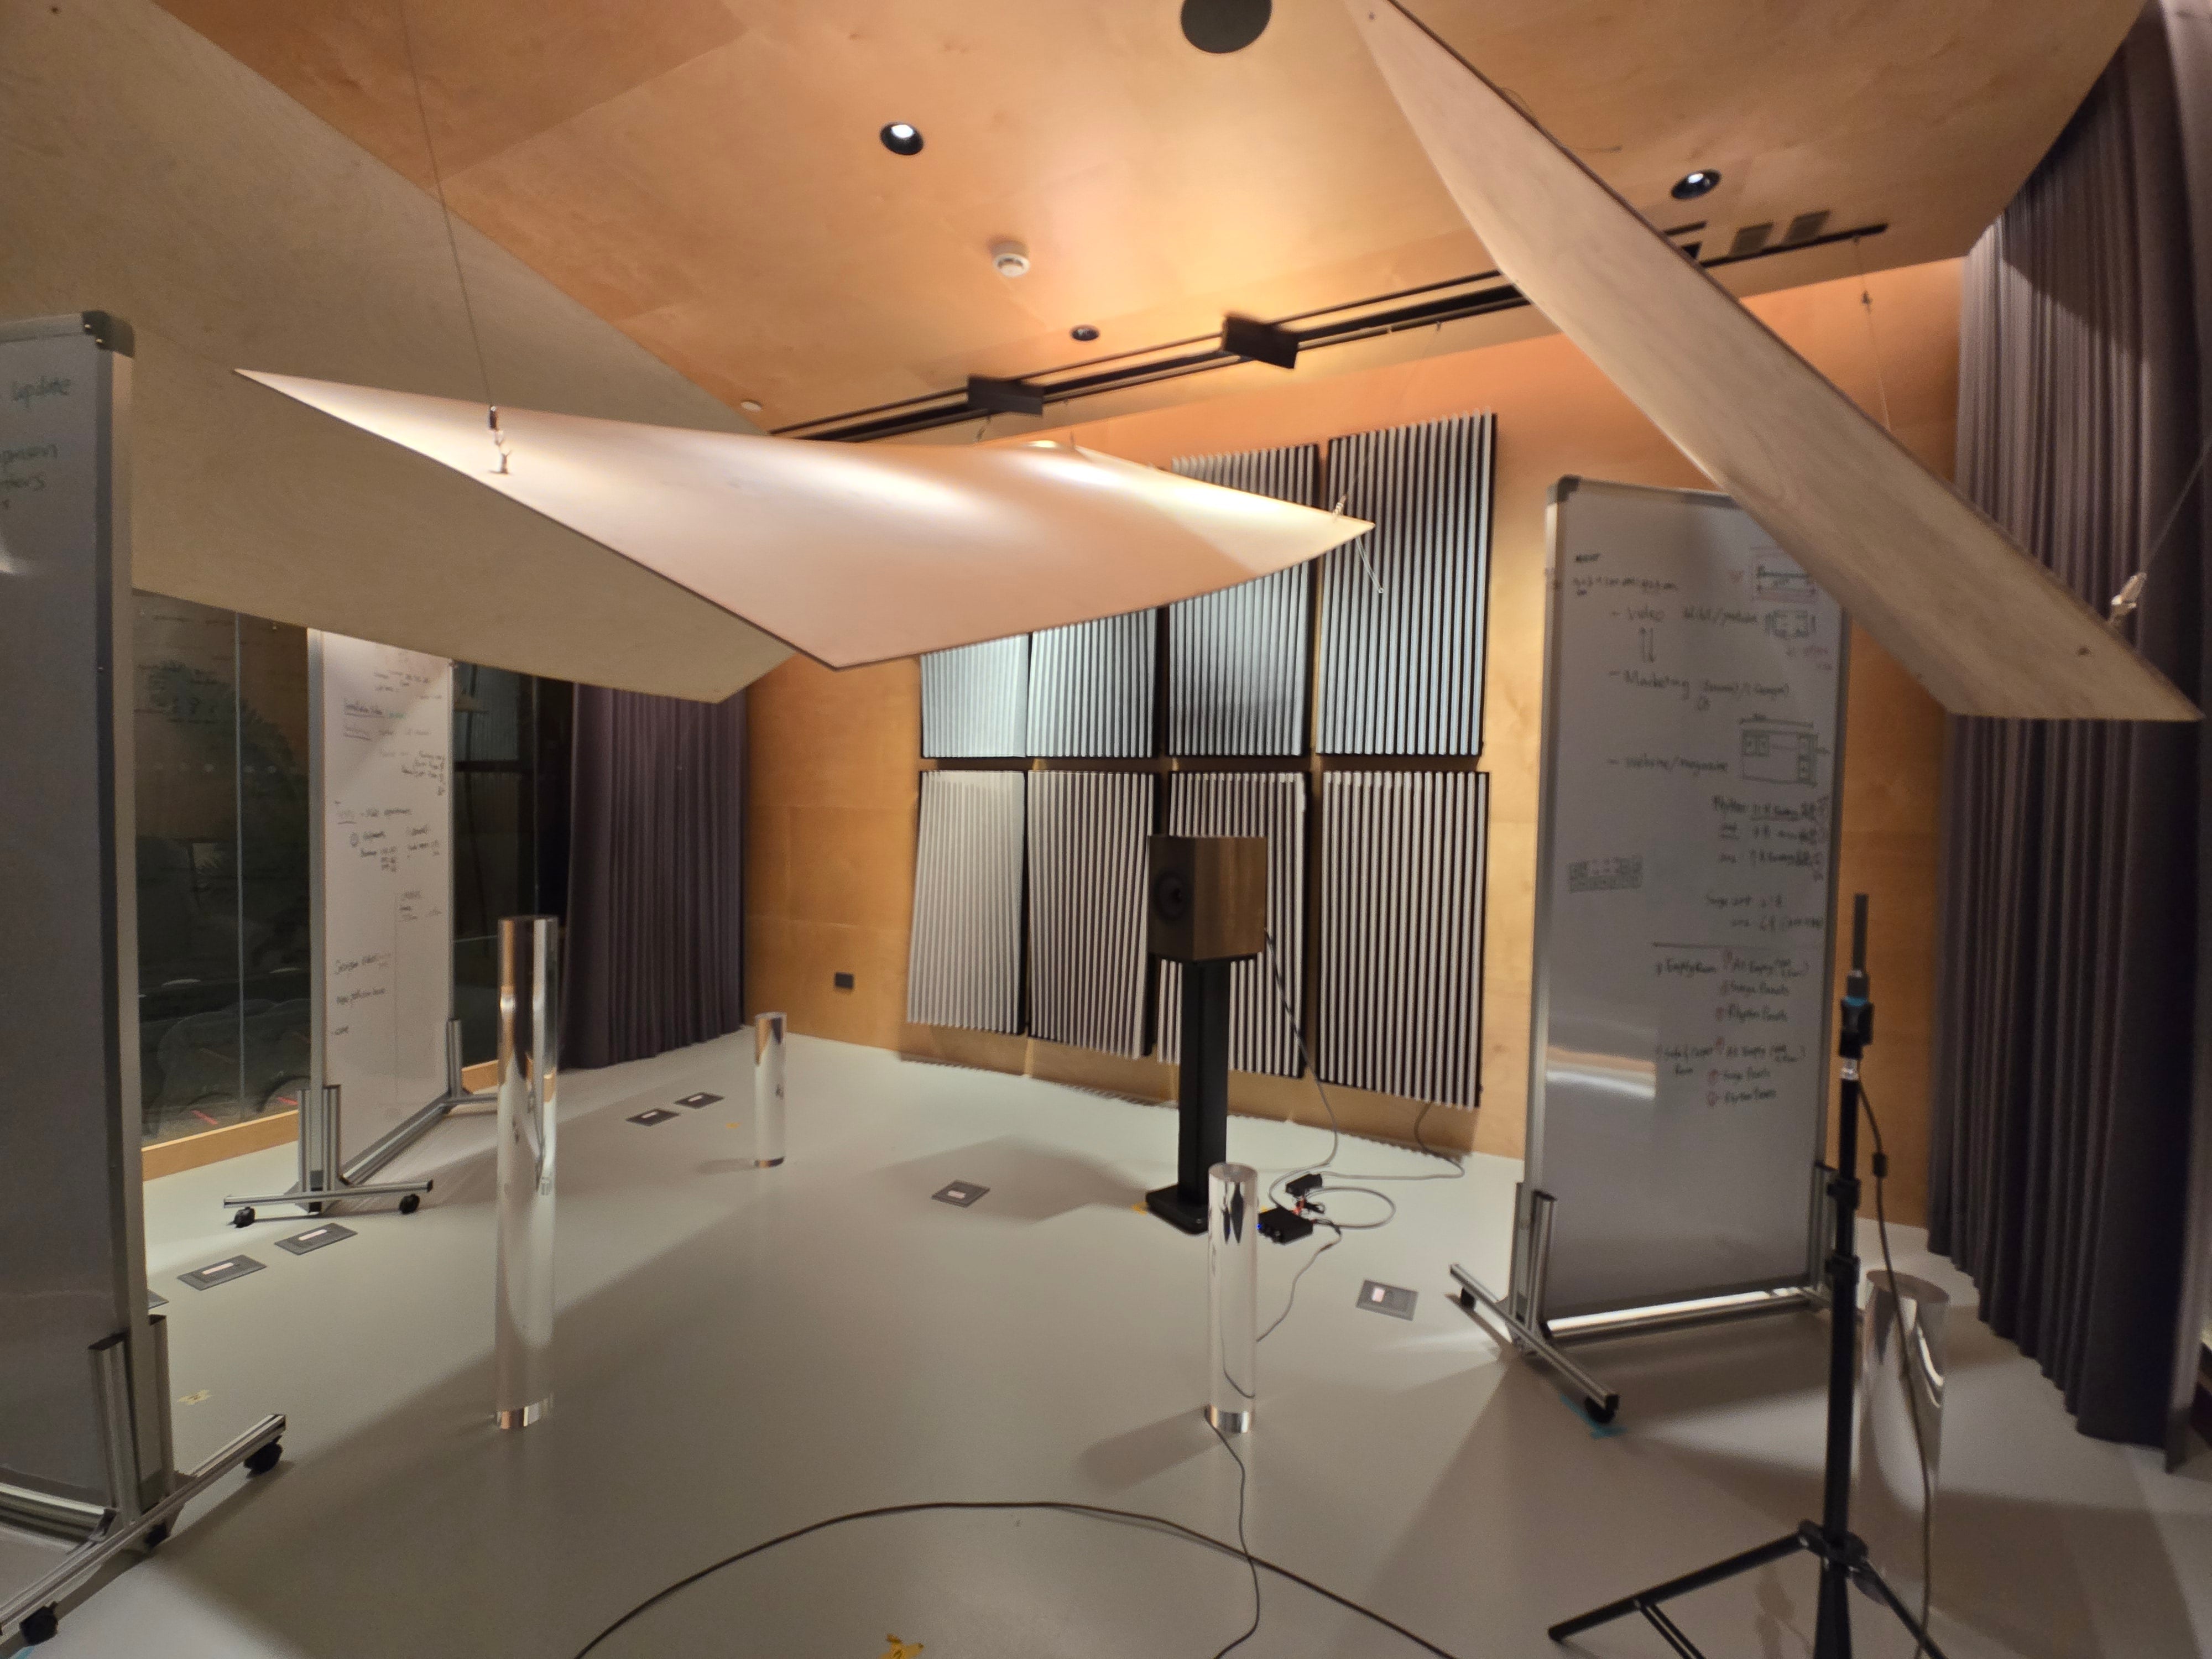
Diffusive Room Treatment for Accuracy
To reduce comb filtering and ensure more accurate decay readings, we installed lightweight diffusive elements and ceiling reflectors. These help scatter sound and create a more diffuse sound field — critical in small rooms — so that measurements aren't skewed by early reflections or standing waves.
This gives us a reliable, realistic performance benchmark:
-
Rhythm Pro NRC: 0.90
-
Rhythm + Bass Trap NRC: 1.05
These values are based on averaged measurements with calibrated correction applied.
Result Graph
*(Below: Absorption Coefficient across Frequency)*

This waterfall plot shows the difference in how the room decays sound over time.
The treated room (with 8 Rhythm Pro panels + ceiling diffusion) absorbs energy more evenly, especially in the 100–5000 Hz range, reducing lingering reflections that muddy detail.

Untreated room — strong ringing and slow decay below 400 Hz, overall decay time till 50db is about 360ms
![]()
Treated room — faster decay and smoother response, overall decay time till 50db dropped to about 180ms


Share:
When Labs Say No: Why We Had to Rethink Acoustic Testing
Behind the Numbers: Our Acoustic Testing Explained