

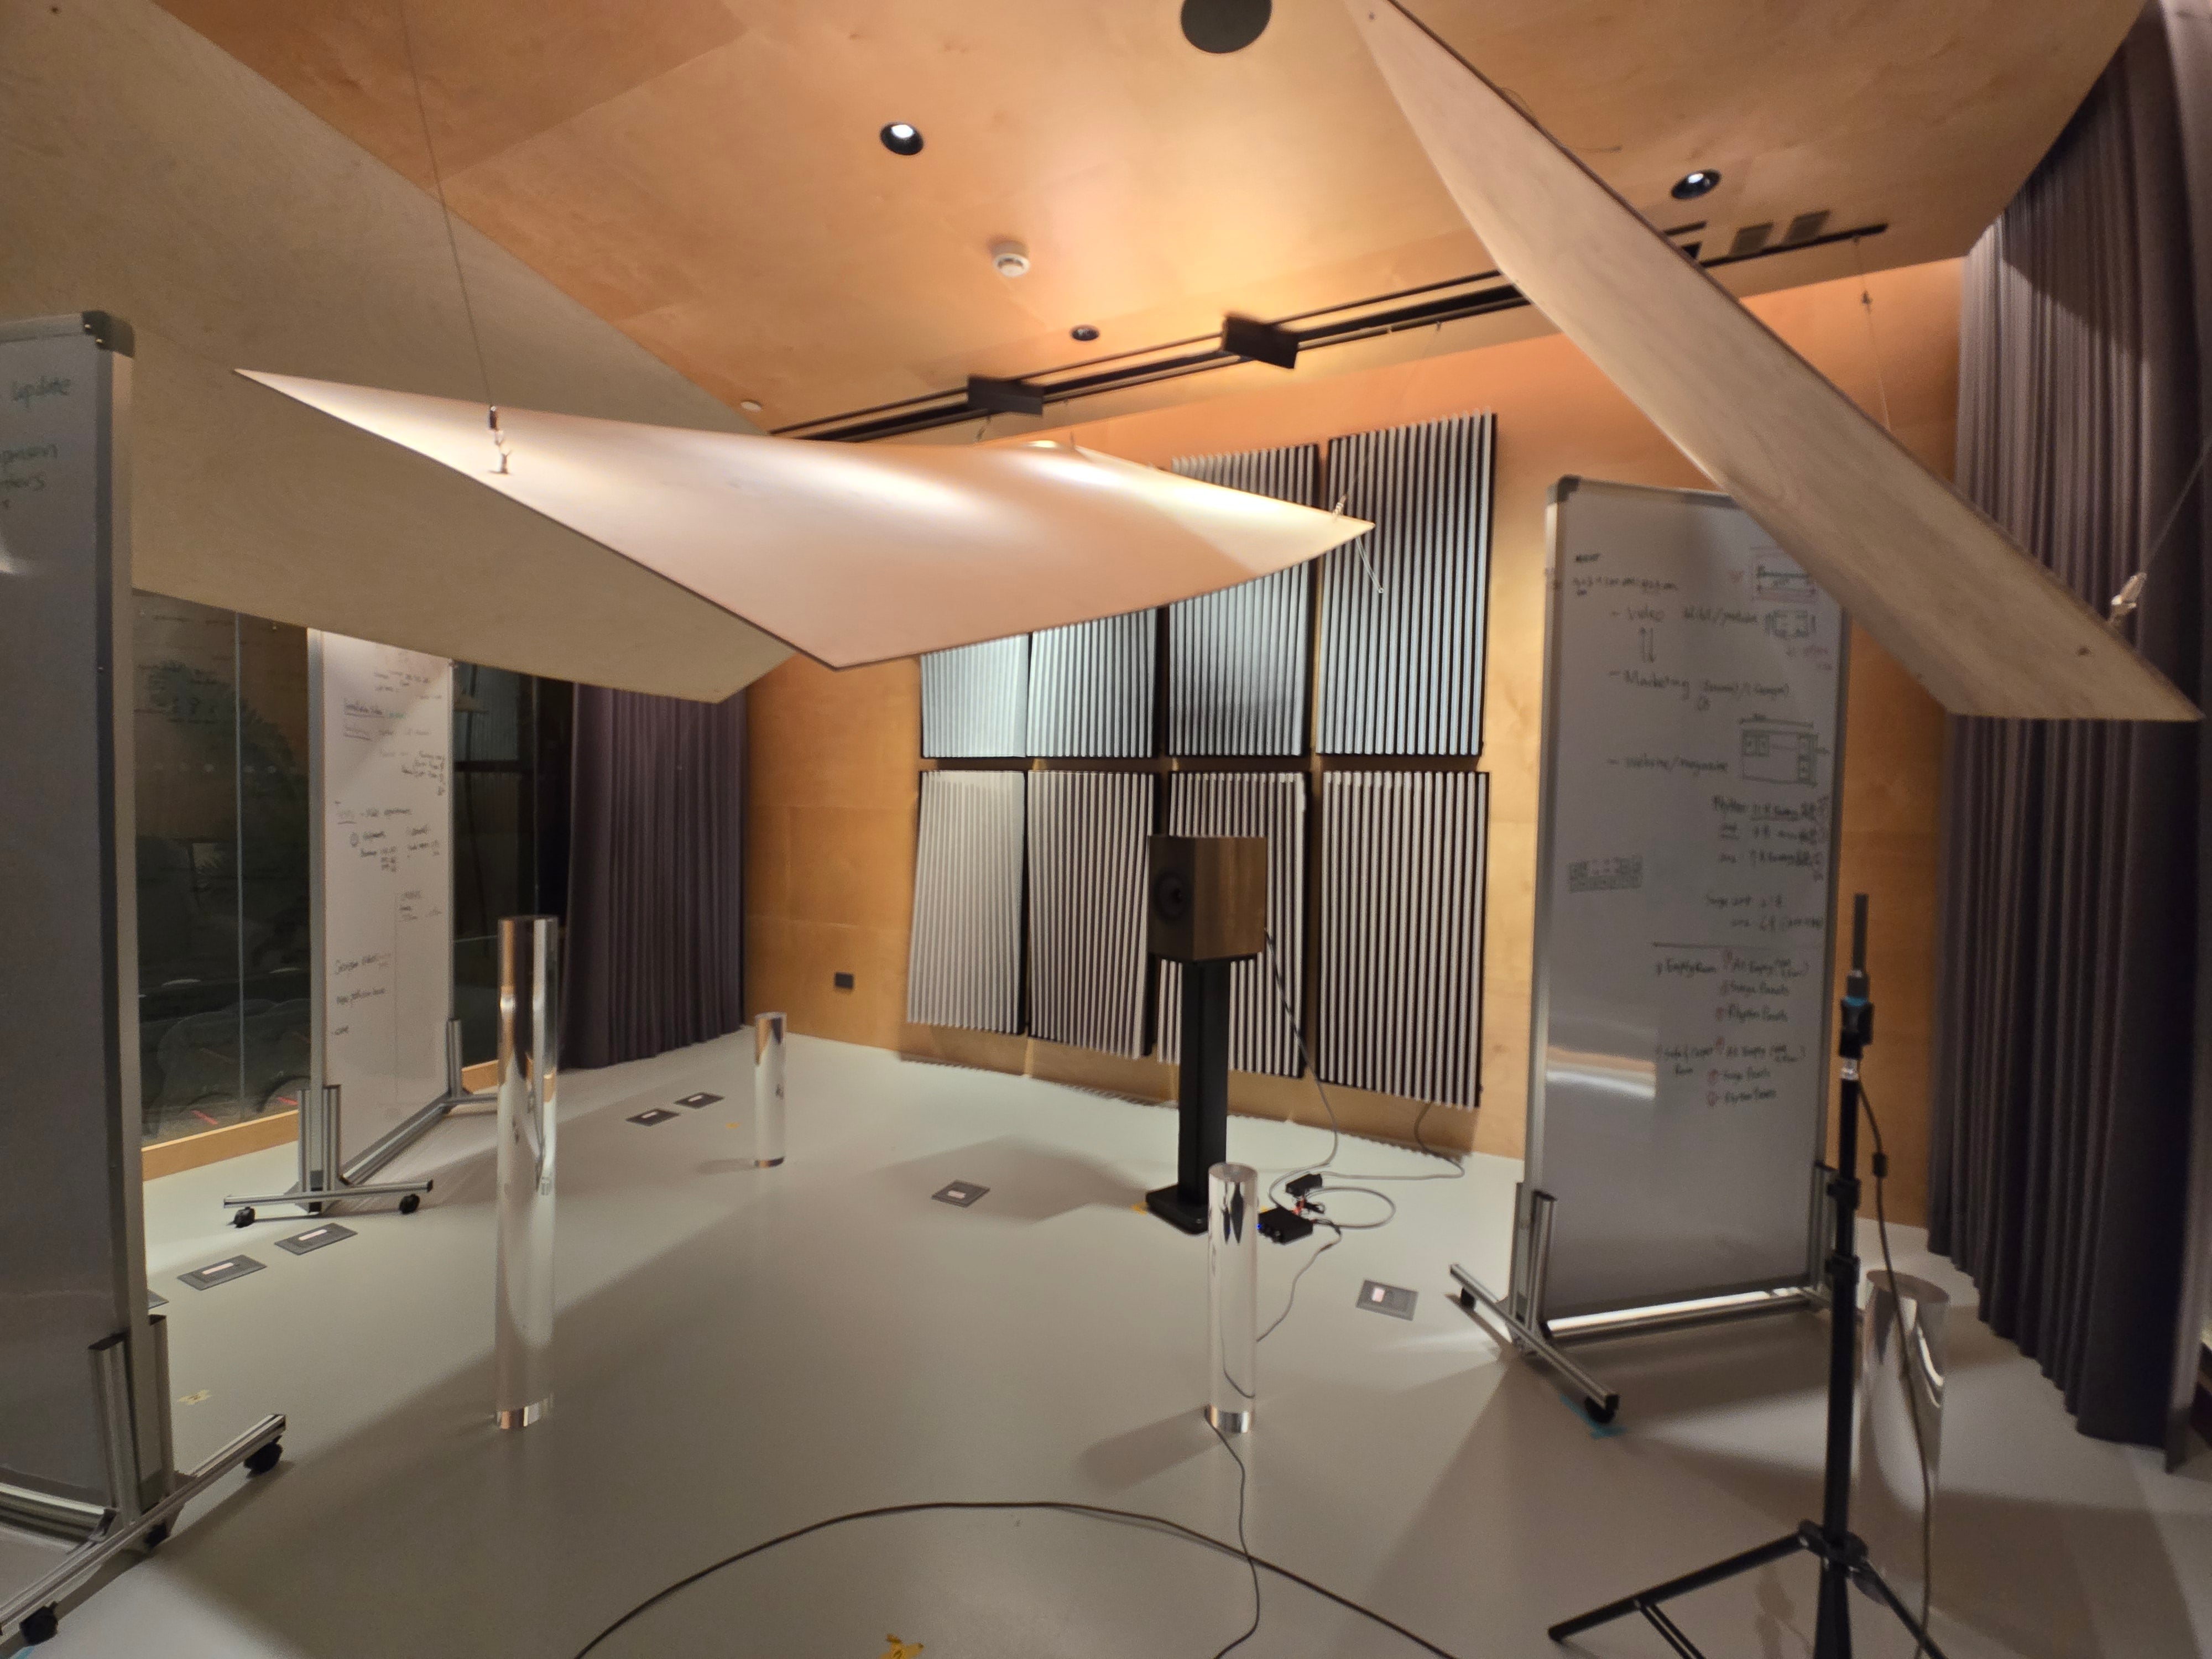
We measured eight Rhythm Pro 2'x4' panels in our own studio, calibrated the result against Surge Pro's laboratory test, and published the raw files. This page sets out how we did it, what the panels changed in the room, and where the result stops.
What we tested
The room is Massform's studio, 55.5 m³, with no acoustic panels of its own. We used a calibrated microphone and REW rather than a laboratory: tools a home studio owner can buy (REW is free), so anyone who wants to repeat the measurement can.
Rhythm Pro's felt slats stand out from the wall, so sound reaches both sides of every slat: more than four times the felt of a flat fabric-wrapped panel the same size, measured from our 3D models. That extra felt matters most in the mids. Low frequencies need depth instead: the air gap behind the panel, and the Basstrap.

Equipment and setup
- Microphone: UMIK-1, calibrated, with its 90-degree calibration file (microphone pointing up)
- Speaker: KEF Q350
- Amplifier: ICEpower 100AS2
- Software: REW (Room EQ Wizard)
- Room: 19.6 m² floor, 55.5 m³
- Microphone positions: 4, with 5 sweeps at each, averaged: 20 sweeps per condition
- Panels: 8 Rhythm Pro 2'x4', four across and two high on one wall behind the speaker: 5.4 m² of panel face
- Mounting: on the wall with its 35 mm air gap
- When: 28 May 2025. The empty room, Surge Pro and Rhythm Pro were measured the same afternoon
Calibration and method
Surge Pro has a laboratory result. The Acoustics Laboratory at National Taiwan Ocean University (NTOU) tested it to ASTM C423-22: NRC 0.95 without Basstrap, 1.15 with it (reports A-10-2025 and A-11-2025). We then measured eight Surge Pro 2'x4' panels in our studio with the same rig. In the room, Surge Pro's four-band average came out at 0.970; the laboratory's is 0.9725, and both round to NRC 0.95. Single bands differed by as much as 0.46, which is why the comparison is used band by band rather than as one number.
Surge Pro in the laboratory against Surge Pro in this room gives a calibration offset for each band, and we add it to Rhythm Pro's in-room result. The offset we used is printed band by band in the Rhythm Pro sheet below, beside the measured values. It comes from a Surge Pro run that is not among the files on this page, and its bands differ from the offset the published Surge Pro run gives (at 500 Hz, +0.21 against +0.46). Either one puts Rhythm Pro at NRC 0.85. The result is our best estimate of what a laboratory would read. It is not a laboratory result, and we label it accordingly: Massform office REW measurement, calibrated against Surge.

The reference run: eight Surge Pro panels in the same room, measured with the same rig and method.
Why an in-room test as well as the lab
We are often asked why Rhythm Pro has no laboratory report. It has not been through a laboratory test yet. Surge Pro has, and its reports are published in full in our lab test write-up.
A laboratory test is the reference anyone can repeat: a reverberation room, a large specimen and a standard method. Nobody listens to music in a reverberation room, though, so we also wanted to know what the panels do in a room the size of a living room or a home studio. The in-room measurement answers that, and calibrating it against Surge Pro's laboratory result ties it back to the standard.
The method is open and repeatable. The raw REW files and the full spreadsheet are at the bottom of this page, so you can check our working rather than take our word for it.
The room setup
For the measurements we fitted lightweight diffusers and curved wooden ceiling reflectors. Their job was to break up flutter echo between the hard floor and ceiling and make the sound field more even, so that one strong reflection does not dominate the readings. They do little for the room's low-frequency modes, which is one reason the results below 250 Hz are less reliable in a room this size.
The ceiling reflectors were up for every sweep, the empty room included, so they are part of the baseline, not part of the result.

Hanging the ceiling reflectors before the measurements.
The result
- Rhythm Pro without Basstrap: NRC 0.85
- Rhythm Pro with Basstrap: NRC 1.00, calculated, not measured
Source: Massform office REW measurement, calibrated against Surge; the with-Basstrap figure is calculated from it, as described below. NRC is the average of the 250, 500, 1000 and 2000 Hz bands, rounded to the nearest 0.05. Before rounding, the averages are 0.8575 and 1.015. Without the calibration offset, the panel's four bands average 0.87, so the correction changes the headline very little; it matters more band by band.
The with-Basstrap figure was not measured in the room. It is the in-room panel curve plus the difference a 50 mm Basstrap Pro made to Surge Pro in the NTOU laboratory, band by band.
Absorption by frequency
| Frequency (Hz) | Rhythm Pro, panel alone (in-room, calibrated) | Rhythm Pro with Basstrap (calculated) |
|---|---|---|
| 125 | 0.24 | 0.41 |
| 250 | 0.37 | 0.96 |
| 500 | 0.85 | 0.89 |
| 1000 | 1.08 | 1.09 |
| 2000 | 1.13 | 1.12 |
| 4000 | 1.14 | 1.22 |
These are the octave centre bands of the published one-third-octave curve. The curve from 100 Hz to 4 kHz is on the Rhythm Pro product page as an interactive chart, and every band and microphone position is in the spreadsheet below. If one-third-octave charts are new to you, this guide walks through one.
Values above 1 are a normal result when sound reaches the felt from the edges as well as the face; why an NRC over 1.0 is possible explains it. At the other end, the panel alone absorbs little below 250 Hz, and at 160 and 200 Hz the room measurement swings either side of zero: in a room this size, the room's own modes swamp what the panels do in those two bands. In the calculated curve, the Basstrap lifts 250 Hz from 0.37 to 0.96. Below about 150 Hz, start with where the speakers and the listening seat sit; the bass trap guide covers what a Basstrap can and cannot do.
How the room's decay changed
These waterfall plots show how the sound in the room dies away after each test sweep, at mic position 1. With 8 Rhythm Pro panels on one wall, 5.4 m² of panel face or about a tenth of the room's wall area, it dies away faster from about 500 Hz up. Below 250 Hz, where the table above shows the panels absorbing much less, the decay barely changes.

Untreated room: strong ringing and slow decay below 400 Hz. Averaged over all four mic positions, the reverberation time (T20) at 1 kHz is 0.53 s.

Treated room: faster decay from about 500 Hz up. T20 at 1 kHz drops to 0.39 s, about a quarter shorter. Across all four positions and 20 sweeps, T20 falls by 25 to 27% from 1 to 8 kHz, 18% at 500 Hz, 9% at 250 Hz and 3% at 125 Hz.

T20 is the reverberation time worked out from the part of the decay between 5 and 25 dB down, extrapolated to 60 dB.
More coverage shortens it further. By our estimate, not a measurement, about three times as many panels would halve T20 above 1 kHz in this room. How much a given number of panels changes a room depends on how much the room already absorbs, so a percentage of wall coverage does not carry over from one room to another. Hear your room estimates the echo in yours with and without panels and suggests a count, and Plan in 3D then shows where they go. Both give estimates, not measurements.
Download the data
- Empty room, REW .mdat file
- Rhythm Pro, REW .mdat file
- Surge Pro, REW .mdat file
- Google Sheet: Rhythm Pro absorption data, every band and position
- REW software download (free)
Open the .mdat files in REW to see every sweep. In the spreadsheet, the column headed RT60 is T30: the decay between 5 and 35 dB down, extrapolated to 60 dB.
Rhythm Pro comes in 2'x4' and 2'x2'. To see it beside the other panels, open the compare page. If you would rather send a photo of your room and ask, the concierge is an automated acoustics concierge trained by the Massform team.

Corrected October 2026. This page used to give Rhythm Pro's NRC as 0.90 and 1.05. Those came from a chart that rounded the four-band average up; ASTM C423 rounds to the nearest 0.05, which gives 0.85 and 1.00 from the same data. It also said the room's decay time halved, from about 360 ms to 180 ms. That was read by eye off the waterfall plots, which are better for looking at than for reading numbers from. Rechecked against the raw files above, the decay is about a quarter shorter from 1 kHz up, as set out in this article.



Share:
What the Labs Don’t Tell You About Bass, and How We Built Around It
Behind the Numbers: Our Acoustic Testing Explained