

Because no one wants to pretend they know what 315Hz means
Let’s be honest: 1/3 octave absorption charts look intense. A wall of frequencies, decimals, and alpha values that feel more like an audiology exam than something for your living room.
But if you know how to skim them, they can tell you most of what you need to know about how a panel will actually feel in a room.

So let’s break it down, in human terms.
What Is a 1/3 Octave Chart?
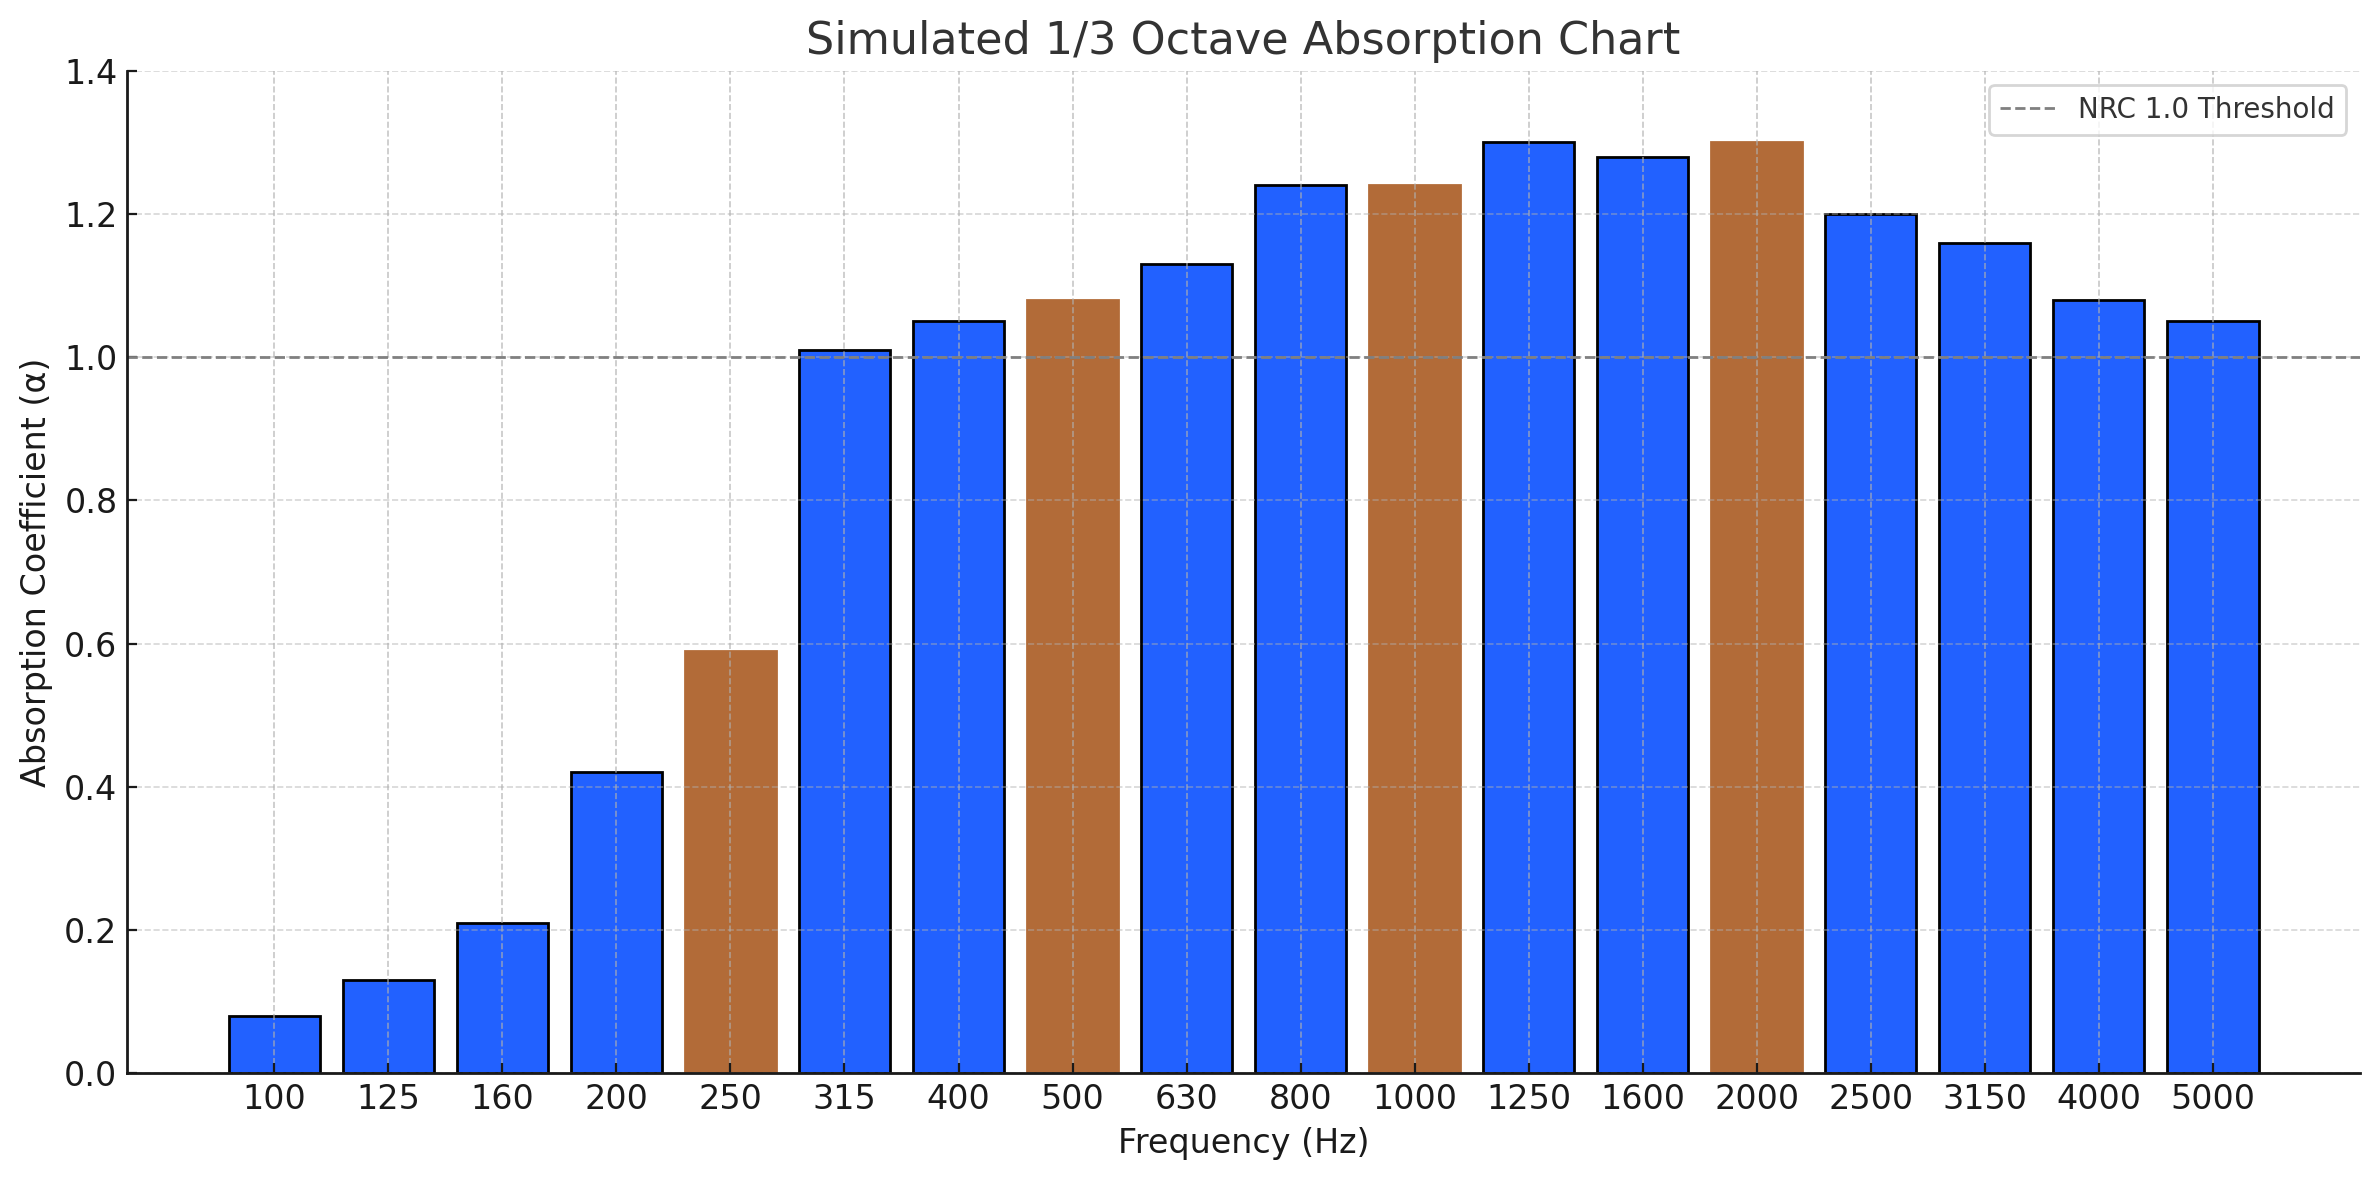
It’s a graph that shows how much sound energy a panel absorbs at different frequencies, broken down into fine steps, usually from 100Hz to 5kHz.
Each number (like 125Hz, 250Hz, 500Hz, etc.) represents a “band” of frequencies. 1/3 octave just means we’re slicing that range into more precise pieces than the usual 4-band NRC average.

An illustration, not a test result: the chart is simulated, as its title says. The four brown bars (250Hz, 500Hz, 1kHz and 2kHz) are the bands NRC averages, and the dashed line marks a coefficient of 1.0. Real laboratory values for one configuration are in the table further down.
What It Shows:
- Low frequencies (100Hz to 250Hz): Bass and boom. Sub-bass sits below 100Hz, off the chart.
- Mid frequencies (250Hz to 2kHz): Vocals, body, warmth
- High frequencies (2kHz to 5kHz): Presence and consonants, the edges of words
- Above 5kHz: Sibilance, sparkle and air. Not on the chart at all: laboratory tests to ASTM C423, ours included, usually stop at the 5kHz band.
Each bar shows an absorption coefficient (α).
-
0.0 = reflects all sound
-
1.0 = absorbs all sound
-
Above 1.0? Possible, and not a typo. Vol. 1 explains why.
What to Look For (Even If You’re Not an Engineer):
Where does the curve start to rise?
If absorption is already strong at 160Hz or 200Hz, the panel is working on the upper bass and low mids, where boom and boxiness build up. That is not the whole bass range, so check the 100Hz and 125Hz bars too. In the example below, that is where the curve drops. If it starts at 500Hz? It might leave your bass untouched.
Is it strong from 500Hz to 2kHz?
This is the vocal clarity zone, especially important for podcasters, singers, or therapists.

Does it taper off or stay smooth up high?
A smooth high-end means less room slap. A jagged falloff might leave flutter echoes.
Real example: Surge Pro with Basstrap, laboratory report A-11-2025
| Frequency | Absorption (α) |
|---|---|
| 160 Hz | 0.83 |
| 315 Hz | 1.28 |
| 500 Hz | 1.19 |
| 1000 Hz | 1.11 |
| 2000 Hz | 1.04 |
| 4000 Hz | 0.96 |
Absorption coefficients from the laboratory's report A-11-2025. Tested by NTOU to ASTM C423-22, April 2025: 19 panels, 10.999 m², raised 35 mm with open edges, each on a 50 mm Basstrap. Download the report (PDF)
Translation:
This combination is already strong at 160Hz, peaks in the low mids and stays strong up to 4kHz. Below 160Hz it falls away, to 0.26 at 100Hz and 0.25 at 125Hz in the same report, so read it as upper bass and low mids, not the low bass beneath them.
You’ll feel this as clearer low mids, cleaner vocals and less echo, not just quietness.

TL;DR
You don’t need to memorize all the numbers. Just look at the curve:
- Early rise = upper bass and low mids
- Mid bump = speech clarity
- Smooth top = less echo
If it reads like music, it’ll probably feel like it too.
What no chart shows is your room: its size, its hard surfaces and how much of them the panels will cover. For that part, Hear your room takes your room’s size and surfaces, lets you hear it as it sounds now and with panels, and suggests how many panels it would take. It is an estimate, not a measurement, which is still more than a chart will volunteer.



Share:
Beyond the Specs: What Is an Air Gap, and Why Does It Help?
Wave & Surge: Two Expressions of the Same Motion